
The 8 Essential Criteria for Evaluating School Bus Routing Software in 2026
TL;DR
Quick Answer: School bus routing software evaluation means comparing vendors across eight criteria: SIS integration, implementation support, total cost of ownership, scalability, security, reporting, usability, and vendor stability.
Do this first: Verify bidirectional API integration with your SIS platform. If your SIS is PowerSchool or Infinite Campus, reject any vendor without client references using your exact version.
Budget reality: Add 30-50% to license costs for TCO. Timeline: 8-12 weeks (medium districts). ROI: Districts commonly report fuel savings in the high single to low double-digit range, with significant overtime reductions within year one.
Table of Contents
- 8 Essential Evaluation Criteria
- Common Evaluation Mistakes
- Cloud vs On-Premise: Which to Choose?
- Implementation Timeline Expectations
- How Much Does Routing Software Cost?
- ROI Calculation Framework
- Frequently Asked Questions
The School Bus Routing Software Decision: Why It Matters in 2026
Direct answer: School bus routing software evaluation means systematically comparing vendors across eight criteria—SIS integration, implementation support, total cost of ownership, scalability, security, reporting, usability, and vendor stability—to ensure operational efficiency and long-term success.
Your software decision determines efficiency or costly workarounds for years. The United States operates 480,000 school buses transporting 26 million students daily. Transportation directors face pressure to optimize routes, reduce costs, and improve safety.
The market reached $1.03 billion in 2023. Growth stems from cloud adoption, GPS tracking, and parent communication tools. Yet many districts select software based on feature checklists rather than proven frameworks.
Do this before you start: Document your district's current pain points. Interview drivers, coordinators, and parents. Identify must-have features versus nice-to-have capabilities. This prevents vendor-led feature creep during evaluation.
This guide provides a systematic evaluation methodology. Drawing from thousands of district implementations, we've identified patterns predicting success. For foundational knowledge, learn school bus routing fundamentals before vendor comparison.
What Are the 8 Essential Criteria for Evaluating School Bus Routing Software?
Answer Capsule: Prioritize integration capabilities, implementation support, and total cost of ownership over feature counts. Districts with verified SIS integration and dedicated implementation teams report 40% faster time-to-value and 30% higher feature adoption.
1. SIS Integration (Priority: CRITICAL)
Definition: The automated, bidirectional API-based connection between the routing system and the Student Information System (SIS) to ensure real-time data accuracy.
Integration starts here. Your Student Information System must connect to routing software. PowerSchool, Infinite Campus, Skyward, and Sapphire account for a large share of the K-12 SIS market.
Check this: Verify the data sync is bidirectional and API-based. Avoid solutions relying on fragile file exports. One transportation director in Ohio shared: "If SIS sync isn't perfect, the routing team never trusts the data—and we abandon half the features."
Ask vendors for client references using your specific SIS platform. Generic "we integrate with all systems" claims mask gaps surfacing during implementation.
2. Implementation Support (Priority: CRITICAL)
Definition: Comprehensive professional services including dedicated project management, data migration assistance, customized training, and post-go-live optimization reviews.
Implementation support distinguishes partners from vendors. Districts with dedicated teams report smoother deployments.
Look for data migration assistance, customized training, and go-live support. Dedicated implementation support includes onsite training, webinars, and post-launch optimization.
3. Total Cost of Ownership (Priority: CRITICAL)
Definition: The full expense of the software over 5 years, including license, implementation, training, annual support, and necessary hardware/infrastructure.
License fees represent 50-70% of true costs. Implementation adds 15-25%. Annual support adds 18-22%. Training runs $2,000-$10,000. Hardware adds $200-$400 per bus.
Districts underestimate tablet costs. The $200 device seems cheap, but mounts, cases, and data plans triple the cost. Budget 30-50% beyond license pricing for complete TCO. Request transparent pricing before shortlisting. For detailed cost breakdowns, contact vendors with district specs.
4. Scalability (Priority: HIGH)
Software must grow with your district. Daily routing is baseline. Special needs transportation, field trips, athletic events, and activities require additional capacity.
Districts add bell time optimization, ride-share matching, and hazard identification later. Ensure software scales without re-implementation.
5. Security & Compliance (Priority: CRITICAL)
FERPA compliance protects student data privacy. SOC 2 Type II certification demonstrates security controls. Ask about Zero Trust Architecture, data encryption at rest and in transit, role-based access controls, and disaster recovery.
Districts face increasing cybersecurity threats. Software lacking security creates liability. Schools are ransomware targets.
6. Reporting & Analytics (Priority: MEDIUM)
Data-informed decisions require strong reporting. Standard reports include route efficiency, driver hours, and fuel consumption. Custom builders enable ad-hoc analysis for boards and budgets.
Real-time dashboards provide operational visibility. Monitor bus locations, track delays, and respond to parent inquiries without phone tag. Explore advanced reporting capabilities for budget planning.
7. Usability (Priority: HIGH)
Staff adoption depends on usability. Coordinators, drivers, parents, and administrators interact with different components. Modern routing platforms provide role-specific interfaces.
Driver navigation apps offer turn-by-turn guidance with real-time communication. Parent portals enable bus arrival notifications. If drivers can't use it easily, adoption fails.
8. Vendor Stability (Priority: MEDIUM)
Long-term support requires stability. Evaluate track record, client retention, and financial health. Market leaders include Transfinder Routefinder Plus, Tyler Technologies Traversa, Edulog, and TripSpark.
Check how long clients stay. High retention signals satisfaction. Established vendors backed by R&D investment avoid abandonment risks.
How to use this table: Score each vendor across all eight criteria. Assign weights based on your priorities. Districts serving diverse populations weigh integration higher. Districts with aging fleets prioritize reporting for maintenance tracking. Compare total weighted scores to identify top candidates.
Key Takeaway: High/Medium/Low importance weights help prioritize district-specific needs. Focus on your top 3 critical criteria.
|
Evaluation Criterion |
Importance |
Key Questions to Ask |
Red Flags to Avoid |
|
SIS Integration |
CRITICAL |
Does this connect to our specific SIS? Show me 3 clients using our exact version. |
"We can integrate with anything" without references |
|
Implementation Support |
CRITICAL |
What's included? How many onsite days? Who's our dedicated contact? |
No dedicated team or self-guided setup only |
|
Total Cost of Ownership |
CRITICAL |
What's included beyond the license? Annual maintenance? Hardware needs? |
Unclear pricing, many "optional" add-ons for basic features |
|
Scalability |
HIGH |
Can this grow with us? Handle special needs, field trips, and activities? |
Major upgrades required for additional use cases |
|
Security & Compliance |
CRITICAL |
FERPA compliant? SOC 2 Type II? Zero Trust Architecture? Data encryption? |
No security certifications, vague data protection answers |
|
Reporting & Analytics |
MEDIUM |
What standard reports? Custom builders? Real-time dashboards? |
Limited reporting, no ad-hoc analysis, extra cost for custom |
|
Usability |
HIGH |
Can drivers use this? Parent portal included? Mobile-friendly? |
Complicated interface, poor mobile, separate parent portal cost |
|
Vendor Stability |
MEDIUM |
How long in business? Client retention? Product roadmap? |
High churn, unclear finances, and limited development |
After using this table, Narrow to 3-5 vendors scoring highest on your critical criteria. Schedule demos focusing on your top pain points. Avoid vendors with more than two red flags.
What Are the Most Common School Bus Routing Software Evaluation Mistakes?
Answer Capsule: Transportation directors prioritize feature lists over integration verification, underestimate total cost, skip reference checks with similar districts, and exclude drivers from evaluation. These mistakes extend timelines and increase resistance.
Mistake #1: Feature-Focused Evaluation
Vendors showcase impressive feature lists during demos. Districts purchase software based on capabilities they'll never use.
Do this instead: Focus on must-have features your team will adopt within six months. Advanced features matter only if you implement them. One Michigan director shared: "We bought software with 50 features, but use only 12. The other 38 just confused our staff."
Mistake #2: Ignoring Total Cost of Ownership
License fees represent just 50-70% of true costs. Implementation, training, hardware, and annual support add substantial expenses.
Avoid this by requesting comprehensive pricing before shortlisting vendors. Hidden costs surface during contract negotiations when switching becomes impractical.
Mistake #3: Skipping Reference Calls
Vendors provide references who love their product. Ask for contacts from districts matching your size, geography, and SIS platform.
Ask references these questions: What integration challenges did you face? How long was the actual implementation? What would you do differently? What ongoing support issues occur?
Mistake #4: Excluding End Users
Transportation coordinators and drivers interact with software daily. Their input during demos identifies usability issues early.
Check this weekly: Districts including frontline staff in evaluation achieve higher adoption rates post-implementation.
Mistake #5: Rushing the RFP Process
Evaluation requires 8-12 weeks minimum. Allow time for demos, reference checks, pilot testing, and contract negotiations.
Timeline checkpoint: Rushed decisions lead to costly course corrections later. One Pennsylvania district skipped stakeholder interviews and discovered mid-implementation that their biggest need (parent communication) wasn't included in their selected solution.
Ready to see routing software in action?
Experience a platform addressing all eight evaluation criteria with verified SIS integration.
Get a Demo of the Routing Platform
Cloud vs On-Premise School Bus Routing Software: Which Should You Choose?
Answer Capsule: Cloud solutions offer lower upfront costs, automatic updates, and remote access, but require reliable internet. On-premises provides data control and offline functionality but demands IT infrastructure. Cloud adoption now dominates new implementations, with most districts choosing cloud over on-premise for new projects.
Cloud-Based SaaS Solutions
Cloud routing software runs on vendor servers. Districts access via web browsers and mobile apps.
Advantages: Lower upfront costs ($15-$50/bus/month). Automatic updates and patches. Remote access from anywhere. Scalable capacity. Minimal IT infrastructure needed. Faster implementation (6-8 weeks average).
Disadvantages: Requires reliable internet connectivity. Monthly recurring costs. Less data control. Dependent on vendor uptime.
Best for: Districts with limited IT staff, reliable internet, preference for predictable monthly costs. Cloud adoption now dominates new implementations, with most districts choosing cloud over on-premise for new projects.
On-Premise Perpetual Licenses
On-premise software installs on district servers. IT staff manages infrastructure, updates, and backups.
Advantages: Complete data control. Offline functionality. One-time license fee ($20,000-$100,000+). No recurring monthly costs. Customization flexibility.
Disadvantages: High upfront costs. Manual updates and patches. Requires dedicated IT resources. Longer implementation (12-16 weeks). Hardware refresh cycles add costs.
Best for: Large districts with robust IT departments, unreliable internet, strict data sovereignty requirements, preference for capital expenditure over operational costs.
Decision framework: Evaluate your internet reliability, IT staffing, budget structure (CapEx vs OpEx), and data governance requirements. Most districts now choose cloud as reliability improves and costs decrease. Learn more about cloud-based routing architecture.
|
Factor |
Cloud-Based SaaS |
On-Premise License |
|
Upfront Cost |
Low ($0-$5,000 setup) |
High ($20,000-$100,000+) |
|
Ongoing Cost |
$15-$50/bus/month |
18-22% annual maintenance |
|
Implementation Time |
6-8 weeks |
12-16 weeks |
|
IT Requirements |
Minimal |
Dedicated staff needed |
|
Updates |
Automatic |
Manual (IT manages) |
|
Internet Dependency |
Required |
Not required |
|
Data Control |
Vendor-managed |
Complete control |
|
Scalability |
High (add users instantly) |
Limited (hardware constraints) |
After comparing, Most districts with reliable internet (>99% uptime) choose cloud for lower total cost and reduced IT burden. Districts in rural areas with spotty connectivity consider hybrid approaches or on-premise for mission-critical routing operations.
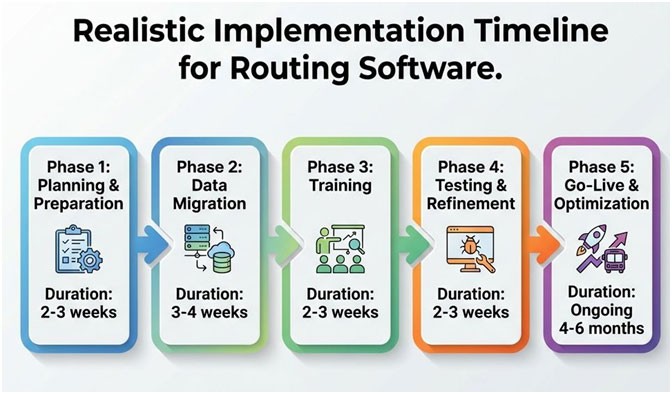
What is a Realistic Implementation Timeline for School Bus Routing Software?
Answer Capsule: Small districts (under 50 buses) need 6-8 weeks. Medium districts (50-200 buses) need 8-12 weeks. Large districts (200+ buses) require 12-16 weeks. Summer months offer optimal windows with fewer disruptions.
Phase 1: Planning & Preparation (2-3 weeks)
Conduct stakeholder interviews. Document current processes. Audit data quality. Define success metrics. Establish project team roles.
Do this in week 1: Interview 5-10 drivers, coordinators, administrators about current pain points. This prevents scope creep later. One Pennsylvania district skipped this step and discovered mid-implementation that their biggest need (parent communication) wasn't included.
Phase 2: Data Migration (3-4 weeks)
Transfer historical route data, student addresses, bus assignments, and driver information from legacy systems.
Clean data migrates faster. Messy data extends timelines significantly. Verify accuracy through sampling before proceeding. Professional data migration services reduce errors and timeline risks.
Phase 3: Training (2-3 weeks)
Coordinators need in-depth route planning instruction. Drivers require navigation app training. Administrators learn reporting. Parents need portal orientation.
Check this during training: Record sessions for future reference and new hire onboarding. Stagger training to avoid overwhelming staff.
Phase 4: Testing & Refinement (2-3 weeks)
Build sample routes. Simulate edge cases. Identify configuration issues. Run parallel operations where old and new systems operate simultaneously.
Some districts extend parallel operation through the first semester. Rushing testing creates operational risks during the school year.
Phase 5: Go-Live & Optimization (Ongoing 4-6 months)
Initial routes require refinement based on actual ridership. Driver feedback identifies navigation issues. Parent communication workflows need adjustment.
Monitor this daily (first month): Performance metrics, parent complaints, driver feedback. Monthly optimization reviews through the first year maximize value.
How to use this table: Set realistic expectations with stakeholders. Plan around school calendar constraints. Summer implementations (June-August) minimize operational disruption. Avoid going live during the first weeks of the school year.
Key Takeaway: Clean data and dedicated project management reduce timelines by 20-30%. Districts with well-maintained records implement faster.
|
Phase |
Duration |
Key Activities |
Success Criteria |
|
Planning |
2-3 weeks |
Stakeholder interviews, process docs, data audit, and team formation |
Clear scope, clean data inventory, defined metrics |
|
Data Migration |
3-4 weeks |
Route data transfer, student import, bus/driver assignments, and address validation |
100% accuracy verification, no duplicates, complete geocoding |
|
Training |
2-3 weeks |
Coordinator training, driver app instruction, admin orientation, parent demos |
All users complete training, 90%+ satisfaction scores |
|
Testing |
2-3 weeks |
Sample routes, edge cases, parallel operation, configuration testing |
Zero critical bugs, successful parallel run, stakeholder approval |
|
Go-Live |
4-6 months |
Route refinement, driver feedback, parent optimization, performance monitoring |
Daily monitoring (month 1), weekly optimization (quarter 1), monthly reviews (year 1) |
After reviewing this table, build a buffer into each phase (add 20% to estimates). Factor in holidays and school breaks. Communicate the timeline to the board and community early to manage expectations.
What is the Total Cost of Ownership (TCO) for School Bus Routing Software?
How Much Does School Bus Routing Software Cost in 2026?
Answer Capsule: Cloud-based SaaS costs $15-$50/bus/month. On-premise licenses range $20,000-$100,000+ by district size. Total cost of ownership adds 30-50%: implementation (15-25%), annual support (18-22%), training ($2,000-$10,000), hardware ($200-$400/bus).
Software Licenses (50-70% of TCO)
License pricing varies: per-bus annual subscriptions, per-student fees, or flat district rates.
Cloud-based SaaS costs $15-$50/bus/month. On-premise perpetual licenses range from $20,000-$100,000+ by district size. Annual maintenance adds 18-22% to perpetual licenses.
Implementation & Professional Services (15-25% of TCO)
Vendors charge for data migration, custom configuration, and integration setup. Implementation fees range 15 to 25% of annual license costs for straightforward deployments.
Complex migrations or extensive customizations increase percentages. Some vendors bundle implementation into year-one pricing. Others itemize separately.
Training & Change Management ($2,000-$10,000)
On-site training costs $1,500-$3,000 per day. Districts need multiple sessions across user groups. Online training reduces costs but decreases engagement.
Budget this: $2,000-$10,000 for comprehensive programs covering coordinators, drivers, administrators, and support staff.
Hardware & Infrastructure ($200-$400 per bus)
Tablets run $200-$400 each. Vehicle mounts add $50-$100/bus. Cellular data plans cost $15-$30 monthly per device.
Districts underestimate this. The $200 device is cheap, but mounts, cases, ruggedization, and data plans triple the real number. Cloud solutions minimize server infrastructure needs. On-premise deployments require server hardware, backup systems, and IT support.
Annual Support & Maintenance (18-22% of license fees)
Support contracts cost 18-22% of license fees annually. These cover software updates, help desk access, bug fixes.
Some vendors include support in subscription pricing. Others charge separately. Clarify what's included before signing contracts. For transparent pricing and detailed TCO calculators, contact vendors with district specifications.
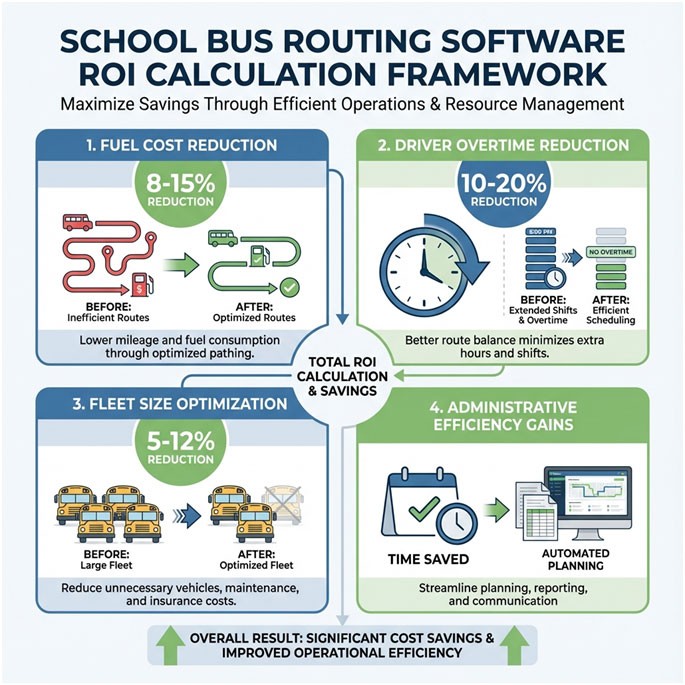
How Do You Calculate ROI for School Bus Routing Software?
Answer Capsule: Districts commonly report fuel cost reductions in the high single to low double-digit percentage range, significant decreases in driver overtime, and fleet size optimization within year one. Total annual savings range $50,000-$500,000 by district size and efficiency improvements.
Fuel Savings (Typical Range: 8-15% reduction)
Optimized routes reduce total miles driven daily. Each 1% route efficiency improvement saves approximately $800-$1,500 annually per bus, depending on fuel prices and consumption rates.
Calculate yours: Current annual fuel costs × 10% efficiency = estimated savings. Districts achieving 10% optimization realize $80,000-$150,000 fuel savings across 100-bus fleets.
Document current fuel consumption baselines before implementation. Measure post-deployment improvements accurately.
Driver Overtime Reduction (Typical Range: 10-20% decrease)
Efficient routing minimizes excessive route times. Balanced driver workloads reduce overtime.
Districts commonly report reductions in driver overtime hours in the 10-20% range after optimization. Calculate current annual overtime costs, then project a 15% reduction as a conservative estimate. A district spending $200,000 on driver overtime saves $30,000 annually.
Fleet Size Optimization (Typical Range: 5-12% reduction)
Right-sizing fleets eliminates underutilized buses. Some districts reduce fleet size through route consolidation and capacity optimization.
Each bus avoided saves $80,000-$120,000 in capital expenditure plus $12,000-$18,000 in annual operating costs. Three buses eliminated save $240,000-$360,000 capital plus $36,000-$54,000 annually.
Administrative Efficiency Gains
Coordinators spend less time on route planning, parent inquiries, and driver communication. Automated systems handle routine tasks.
Estimate value: Time savings converted to FTE equivalents. Recovering 20% of coordinator time equals 0.2 FTE, approximately $12,000-$18,000 annual value.
Break-Even Timeline
Divide total implementation costs by annual savings. Most districts achieve payback within 2-3 years. Continuing benefits accumulate over the software's lifespan.
Build your business case: Five-year ROI calculations provide compelling presentations for budget approval. Document assumptions clearly for school boards.
Frequently Asked Questions About School Bus Routing Software Evaluation
How long does school bus routing software implementation take?
Small districts (under 50 buses) need 6-8 weeks. Medium districts (50-200 buses) need 8-12 weeks. Large districts (200+ buses) require 12-16 weeks. Summer months offer optimal implementation windows with fewer operational disruptions. Data quality significantly impacts timelines—clean, well-maintained records migrate faster than messy data requiring cleanup.
How much does school bus routing software cost?
Cloud-based SaaS solutions cost $15-$50 per bus monthly. On-premise perpetual licenses range $20,000-$100,000+, depending on district size. Total cost of ownership adds 30-50% beyond licenses: implementation fees (15-25% of license cost), annual support contracts (18-22% of license cost), training expenses ($2,000-$10,000), and hardware costs for tablets and mounts ($200-$400 per bus). Budget the complete TCO, not just license fees.
Which routing software do most school districts use?
Market leaders include Transfinder Routefinder Plus, Tyler Technologies Traversa, Edulog, and TripSpark. Selection depends on district size, SIS platform compatibility (PowerSchool, Infinite Campus, Skyward, Sapphire), and specific operational requirements. No single "best" solution exists—the right choice aligns with your district's unique needs and existing technology stack. Request demos from 3-5 vendors matching your requirements.
What ROI should I expect from routing software?
Districts commonly report fuel cost reductions in the high single to low double-digit percentage range, significant decreases in driver overtime hours, and fleet size optimization within the first year. Total annual savings range from $50,000 to $500,000, depending on district size and operational efficiency improvements. Most districts achieve cost recovery within 2-3 years. Continuing benefits accumulate over the software's lifespan, typically 7-10 years before major upgrades.
Which SIS integrations are essential?
Your routing software must integrate with your Student Information System (SIS). PowerSchool, Infinite Campus, Skyward, and Sapphire account for a large share of the K-12 SIS market. Verified bidirectional API-based integration eliminates double-entry data management and ensures accurate student rosters and address updates flow automatically between systems. Avoid solutions relying on scheduled file exports—these create data sync gaps. Ask vendors for client references using your specific SIS platform and version number.
What questions should I ask during vendor demos?
Ask about: verified SIS integration with your specific platform, implementation timeline and support model, training resources and ongoing professional development, data migration process and historical data preservation, security certifications (SOC 2 Type II, FERPA compliance, Zero Trust Architecture), total cost of ownership including all fees, client retention rates and references from similar-sized districts, product roadmap and development investment, scalability for future needs beyond daily routing, and reporting capabilities for board presentations and budget justifications. Prepare a standardized question list for all vendors to enable direct comparison.
Cloud vs on-premise: which is better for school bus routing?
Cloud solutions offer lower upfront costs, automatic updates, and remote access, but require reliable internet connectivity. On-premise systems provide complete data control and offline functionality, but demand IT infrastructure and manual update management. Cloud adoption now dominates new implementations, with most districts choosing cloud over on-premise for new projects as internet reliability improves and costs decrease. Districts with unreliable connectivity (rural areas) or strict data sovereignty requirements may prefer on-premise. Evaluate your internet reliability (target 99%+ uptime), IT staffing levels, budget structure (CapEx vs OpEx), and data governance requirements before deciding.
Next Steps: Moving from Evaluation to Decision
Final Capsule: Districts choosing routing software through structured, criteria-based evaluation see faster deployments, lower operating costs, and higher staff adoption. Prioritize SIS integration, implementation support, and TCO to ensure long-term success.
Systematic evaluation reduces software selection risk and improves outcomes. Start by documenting your district's specific requirements across all eight criteria. Weight each factor by importance to your situation.
Do this in the next 30 days:
- Interview stakeholders (drivers, coordinators, administrators) about current pain points
- Document must-have versus nice-to-have features
- Verify SIS platform version and integration requirements
- Calculate current annual costs (fuel, driver overtime, fleet size)
- Request demos from 3-5 shortlisted vendors
Use the evaluation matrix to score each vendor consistently. Conduct reference calls with similar districts. Request pilot testing if possible before final commitment. Review contracts carefully for hidden costs and service level agreements.
Get a demo to see how comprehensive routing platforms address all evaluation criteria. Explore transparent pricing information to understand the total cost upfront. Access additional resources on route optimization, implementation best practices, and parent communication strategies.
The right routing software transforms transportation operations. Make the decision to serve your district for years to come.
References
- National Highway Traffic Safety Administration. (2024). School Bus Safety. U.S. Department of Transportation.
- School Transportation News. (2024). School Transportation Industry Reports. STN Media Company.
- U.S. Department of Education. (2024). Family Educational Rights and Privacy Act (FERPA). ED.gov.