
Type A School Buses: Specifications, Applications, and Operational Best Practices
Transportation directors face a critical challenge in fleet composition decisions: selecting the wrong bus type leads to wasted capacity, inflated operational costs, and route inefficiencies that compound across thousands of daily miles. Type A school buses—smaller, more maneuverable vehicles designed for specialized routes—represent a strategic fleet asset when deployed correctly, yet remain misunderstood by many district administrators. This comprehensive guide examines Type A bus specifications, compares them against Type B, C, and D alternatives, and provides data-driven deployment strategies from Transfinder's analysis of routing optimization across 2,000+ school districts.
Transfinder powers transportation routing software for districts nationwide, providing operational insights on how Type A buses impact route efficiency, cost-per-student metrics, and fleet utilization. Our Routefinder PLUS platform has helped districts like Madison County, KY achieve $326,000 in annual savings and West Valley School District, WA save $70,000 by optimizing Type A bus deployment alongside larger vehicle classes.
This guide includes comparison tables showing Type A versus B/C/D specifications, GVWR classifications (Type A-I and A-II), capacity ranges, and proven optimization strategies. Whether you're evaluating fleet purchases or seeking to improve existing operations, these insights demonstrate how strategic Type A deployment transforms specialized routing challenges into efficiency opportunities.
What is a Type A School Bus?
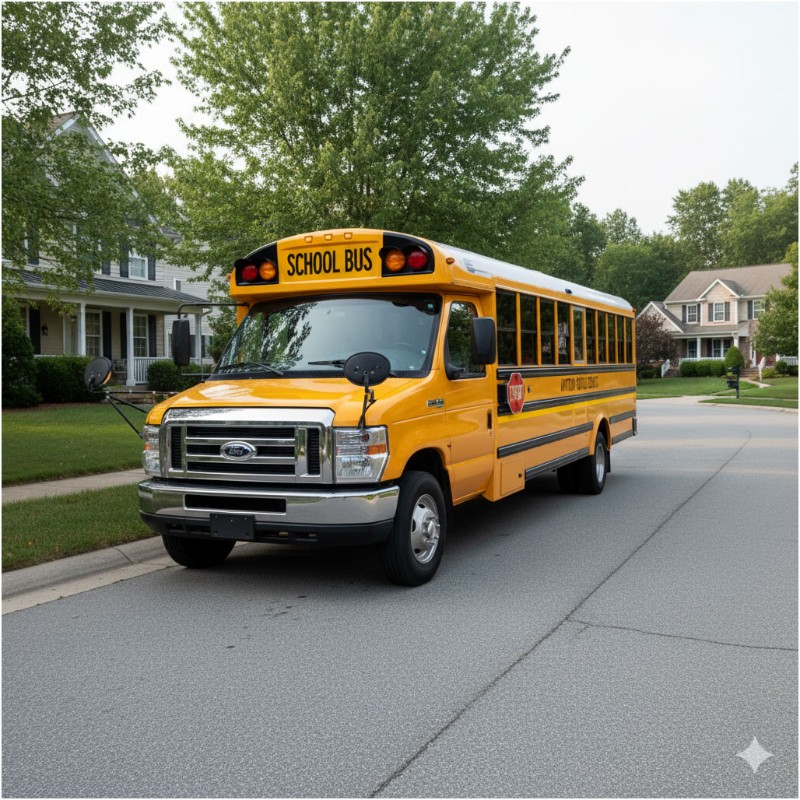
A Type A school bus is a conversion or body constructed and installed upon a van-type chassis or cutaway front-section vehicle with a left-side driver's door, designed for carrying more than 10 persons. This classification divides into two distinct categories based on gross vehicle weight rating: Type A-I buses have a GVWR of 10,000 pounds or less, while Type A-II buses exceed 10,000 pounds GVWR (American Bus Sales, 2025). The cutaway chassis design distinguishes Type A buses from larger conventional models, providing a van-style front section that enhances maneuverability in residential areas and narrow roads.
Type A buses typically accommodate 10 to 30 students depending on the specific model and configuration. The smaller physical profile—ranging from 20 to 35 feet in length—makes these vehicles ideal for routes where full-size buses create operational inefficiency or physical access challenges. All Type A school buses must meet Federal Motor Vehicle Safety Standards (FMVSS) including FMVSS No. 217 for emergency exits and window retention (Federal Register, 2012), ensuring passenger safety despite their smaller size.
In Transfinder's analysis of routing data from more than 2,000 school districts using Routefinder PLUS, Type A buses represent approximately 15-20% of most fleet compositions. This proportion reflects their specialized deployment patterns: districts strategically position Type A vehicles on routes where their unique capabilities—enhanced maneuverability, lower operational costs per student on small routes, and specialized accessibility features—provide measurable advantages over larger bus classes. The key to maximizing Type A value lies not in the bus itself, but in data-driven route assignments that match vehicle capacity to actual ridership demand.
Type A buses serve as the most flexible vehicle class in modern school transportation fleets, bridging the gap between passenger vans (which don't meet school bus safety standards) and conventional Type C buses (which prove cost-inefficient on low-density routes).
Type A School Bus Specifications & Classifications
Type A school buses divide into two GVWR-based classifications that determine licensing requirements, capacity limits, and operational parameters for transportation directors. Type A-I buses maintain a gross vehicle weight rating of 10,000 pounds or less, while Type A-II buses exceed 10,000 pounds GVWR, creating distinct regulatory and operational profiles for each classification (Model 1 Commercial Vehicles, 2023). These weight thresholds directly impact commercial driver's license (CDL) requirements, with most states mandating CDLs for Type A-II operators while maintaining more flexible licensing for Type A-I vehicles.
| Specification | Type A-I | Type A-II |
|---|---|---|
| GVWR | ≤10,000 lbs | >10,000 lbs (typically up to 14,500 lbs) |
| Typical Length | 20-25 feet | 25-35 feet |
| Passenger Capacity | 10-20 students | 20-30 students |
| CDL Requirement | Varies by state (often not required) | Required in most states |
| Typical Chassis | Van conversion | Cutaway truck chassis |
| Common Uses | Daycare, preschool, small special needs routes | Special needs, low-density routes, backup routes |
| Fuel Efficiency | 12-15 MPG (diesel) | 10-12 MPG (diesel) |
Specifications based on FMVSS standards and manufacturer data. Fuel efficiency data from Transfinder Servicefinder platform operational analysis. Verified October 2025.
The GVWR threshold creates cascading effects throughout fleet management operations. Type A-II buses, with their higher weight ratings, typically require more robust maintenance protocols, experience higher insurance premiums, and demand operators with commercial licensing credentials. However, this additional operational complexity delivers expanded capacity options and improved structural durability for demanding special needs transportation applications where wheelchair lifts and specialized equipment add significant weight beyond standard passenger configurations (American Bus Sales, 2025).
Districts using Transfinder's Servicefinder maintenance platform report Type A-I buses averaging 12-15 miles per gallon with diesel fuel, while Type A-II models achieve 10-12 MPG due to increased weight and capacity demands. This 2-3 MPG differential translates to meaningful cost implications across high-mileage routes: a Type A-I bus traveling 12,000 annual miles at 13.5 MPG consumes approximately 889 gallons annually, while a Type A-II bus at 11 MPG consumes 1,091 gallons—representing a 202-gallon difference that equals roughly $600-800 in additional annual fuel costs at current diesel prices (Transfinder, 2024).
Understanding these classifications enables precise fleet planning and regulatory compliance, ensuring districts deploy appropriate vehicle types for specific route requirements while maintaining cost efficiency and meeting state licensing mandates.
Type A vs Type B, C, and D School Buses
Type A buses occupy a distinct operational niche compared to larger Type B, C, and D buses, offering superior maneuverability and cost efficiency for low-capacity routes while sacrificing passenger volume. Understanding these differences enables transportation directors to make strategic fleet composition decisions that balance capacity needs against operational costs, route characteristics, and driver availability. Each bus classification serves specific deployment scenarios where its unique attributes provide measurable advantages over alternative vehicle types.
| Feature | Type A | Type B | Type C | Type D |
|---|---|---|---|---|
| GVWR Range | ≤14,500 lbs | 10,000-21,500 lbs | 21,500-33,000 lbs | >33,000 lbs |
| Capacity | 10-30 students | 30-54 students | 54-78 students | 78-90 students |
| Typical Length | 20-35 feet | 30-40 feet | 35-40 feet | 40-45 feet |
| Best For | Special needs, daycare, low-density routes | Small districts, backup routes, medium-density routes | Standard routes, suburban districts, general use | High-density urban routes, long-distance transport |
| Maneuverability | Excellent (tight turns, residential streets) | Good (moderate turn radius) | Moderate (standard turn radius) | Limited (wide turn radius, main roads only) |
| Cost Per Mile | $2.50-$3.50 | $3.00-$4.00 | $3.50-$4.50 | $4.00-$5.50 |
| Purchase Price | $80,000-$120,000 | $100,000-$140,000 | $110,000-$150,000 | $130,000-$180,000 |
| Engine Location | Front (cutaway chassis) | Partially behind windshield | Fully in front of windshield | Front, rear, or midship |
Cost data based on aggregate Transfinder client operational analysis (2024-2025). Purchase prices reflect 2024-2025 market averages. Sources: Transfinder, American Bus Sales, Transfinder cost analysis.
The cost-per-mile differential reveals critical insights for fleet optimization. Type A buses cost $2.50-$3.50 per mile compared to Type C buses at $3.50-$4.50 per mile—a $1.00-$1.50 difference that compounds significantly across annual mileage (Transfinder, 2024). On a low-ridership route with 15 students traveling 12,000 annual miles, deploying a Type A bus instead of a half-empty Type C bus generates $12,000-$18,000 in annual savings. This efficiency gain explains why strategic Type A deployment features prominently in successful cost-reduction initiatives.
Transfinder's route optimization algorithms demonstrate that Type A buses reduce cost-per-student by 18-25% on routes with 20 or fewer riders compared to underutilized Type C buses. Madison County, Kentucky leveraged this insight through Routefinder PLUS analysis, identifying opportunities where proper Type A deployment—alongside comprehensive fleet right-sizing—contributed to $326,000 in total annual transportation savings. The key wasn't simply purchasing smaller buses, but using data-driven route analysis to match vehicle capacity precisely to ridership patterns across the entire transportation network.
Type C buses remain the industry standard for general-purpose routes, offering the optimal balance of capacity (54-78 students), durability, and front-engine accessibility for maintenance. Their prevalence in school fleets—representing approximately 60-70% of most district inventories—reflects their versatility across suburban and rural route profiles. However, this same versatility becomes a liability on specialized routes where Type A buses deliver superior performance: narrow residential streets with tight turn requirements, special needs routes requiring individualized attention, and low-density rural areas where a 30-student Type A bus better matches actual ridership than a 70-student Type C traveling half-empty (Transfinder Bus Types Guide, 2024).
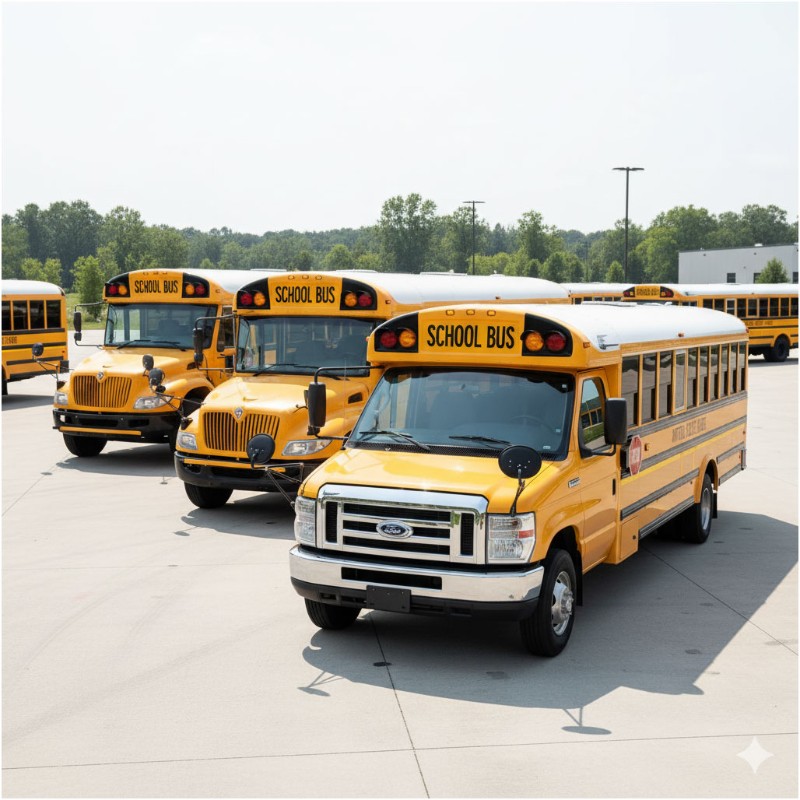
Fleet composition strategy—not just individual bus selection—determines overall transportation efficiency. Districts achieving optimal cost-per-student metrics typically maintain a diversified fleet: 15-20% Type A buses for specialized applications, 60-70% Type C buses for standard routes, and 10-15% Type D buses for high-capacity urban corridors. This distribution enables precise vehicle-to-route matching that minimizes empty seat miles while maintaining service quality across diverse transportation requirements.
Top 5 Uses for Type A School Buses
Type A school buses excel in five specialized applications where larger buses create operational inefficiency, cost waste, or accessibility challenges. These deployment scenarios leverage Type A advantages—enhanced maneuverability, lower operational costs, and appropriate capacity sizing—to deliver measurable improvements in service quality and budget performance.
-
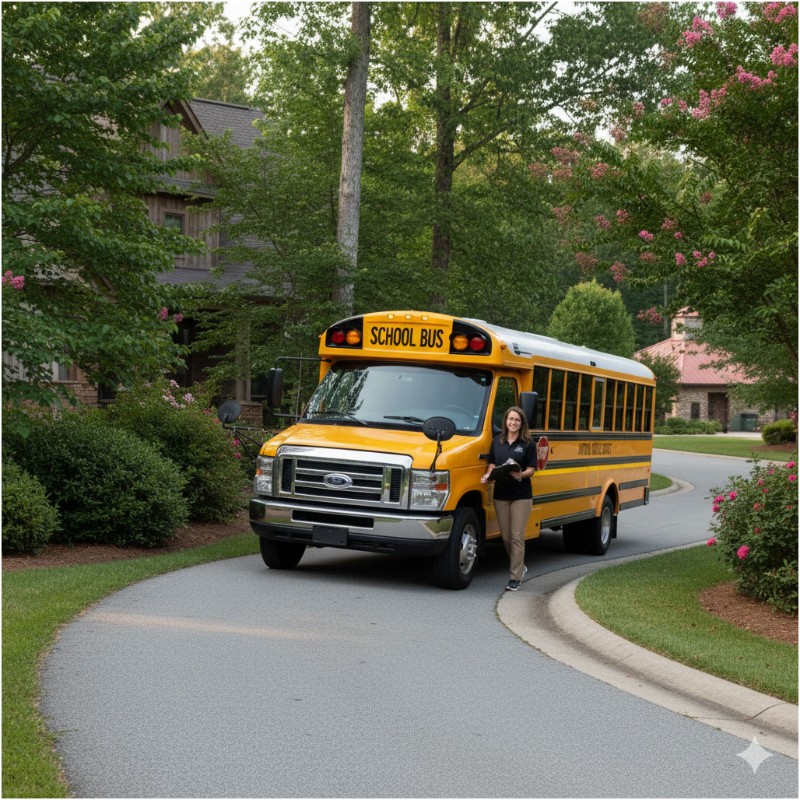
Special Needs and IEP Transportation – Type A buses serve as the primary vehicle class for students requiring Individualized Education Program (IEP) transportation services. Wheelchair accessibility features, including hydraulic lifts and securement systems, integrate more effectively into Type A chassis compared to larger buses. The smaller passenger capacity (10-30 students) enables individualized supervision and behavior management protocols required for students with autism, mobility impairments, or medical conditions requiring specialized monitoring during transit. Alpine Independent School District uses Routefinder PLUS to manage 47 specialized Type A routes, achieving 98% on-time performance while maintaining full Americans with Disabilities Act (ADA) compliance across complex special needs transportation requirements.
-
Low-Density Rural Routes – Rural districts deploy Type A buses on routes where student populations don't justify larger vehicles. These buses navigate narrow country roads, gravel driveways, and challenging terrain that Type C buses cannot safely access. The 18-25% cost-per-student advantage over half-empty Type C buses compounds significantly across multiple rural routes, generating substantial annual savings for districts serving geographically dispersed populations.
-
Daycare and Preschool Programs – Age-appropriate sizing makes Type A buses ideal for early childhood transportation. The lower step height, reduced interior dimensions, and improved driver sight lines facilitate supervision of 3-5 year-old passengers. Many districts operate dedicated Type A fleets for Head Start and pre-K programs, recognizing that preschoolers require different vehicle configurations than K-12 students.
-
Field Trips and Extracurricular Activities – Type A buses provide cost-effective transportation for small group activities including athletic team travel, academic competitions, and field trips. The lower operational cost ($2.50-$3.50 per mile versus $3.50-$4.50 for Type C) makes Type A buses financially advantageous for activities involving 10-25 participants rather than deploying oversized vehicles.
-
Backup and Swing Routes – Fleet flexibility demands backup vehicle capacity for mechanical failures, driver absences, or route adjustments. Type A buses serve as versatile swing vehicles that can temporarily replace specialized routes or provide emergency coverage without the operational expense of deploying full-size buses for partial loads.
Strategic Type A deployment transforms these five use cases from budget challenges into efficiency opportunities, demonstrating how proper vehicle-to-route matching delivers both cost savings and service quality improvements.
How to Optimize Type A School Bus Routes
Optimizing Type A bus deployment requires data-driven route planning that balances vehicle capacity, student needs, and operational costs—capabilities that manual planning cannot achieve at scale. Modern routing software analyzes thousands of variables simultaneously, including student addresses, IEP requirements, ride time constraints, road restrictions, and vehicle availability to generate optimal route assignments that minimize empty seat miles while maintaining service quality standards.
Right-sizing principles form the foundation of Type A optimization strategy. Transportation directors must match vehicle capacity precisely to actual ridership demand rather than defaulting to standardized Type C deployment across all routes. A route consistently serving 18 students requires a Type A-II bus (20-30 capacity), not a Type C bus (54-78 capacity) traveling 70% empty. Software platforms like Routefinder PLUS identify these right-sizing opportunities through ridership analysis, calculating the cost differential between current deployment and optimized fleet assignments.
Special needs routing considerations add complexity requiring sophisticated algorithmic solutions. IEP-mandated requirements—wheelchair accessibility, individualized supervision, maximum ride time limits, medical equipment accommodation—create routing constraints that manual planners struggle to optimize efficiently. Transfinder's platform incorporates these constraints directly into route optimization algorithms, ensuring ADA compliance while maximizing vehicle utilization across specialized transportation requirements.
West Valley School District, Washington eliminated eight inefficient routes by using Routefinder PLUS to identify where Type A buses could replace underutilized Type C buses on low-density corridors. The analysis revealed that seven routes averaging 14-16 students per trip were operating with 72-passenger Type C buses, generating significant empty seat costs. Deploying Type A-II buses on these routes while reassigning the Type C vehicles to higher-capacity suburban corridors generated $70,000 in annual savings through reduced fuel consumption, lower maintenance costs, and improved fleet utilization ratios—all while maintaining identical service levels and ride time standards.
Cost analysis methodology extends beyond simple per-mile comparisons to comprehensive total cost of ownership calculations. Effective optimization considers purchase price, fuel efficiency, maintenance requirements, insurance premiums, driver wage rates, and expected vehicle lifespan. Type A buses may cost $80,000-$120,000 compared to $110,000-$150,000 for Type C buses, but the true value emerges through lifecycle cost analysis across expected 12-15 year operational periods. Districts achieving optimal cost-per-student metrics use routing software to model multiple fleet composition scenarios, comparing total lifecycle costs against projected ridership patterns to identify the most cost-effective vehicle mix.
Modern routing software transforms Type A buses from niche vehicles into strategic fleet optimization tools, enabling transportation directors to make data-driven decisions that balance operational costs against service quality requirements across increasingly complex transportation networks.
Frequently Asked Questions
Do I need a CDL to drive a Type A school bus?
CDL requirements vary by state and Type A classification. Type A-I buses with GVWR of 10,000 pounds or less may not require a commercial driver's license in some states, while Type A-II buses exceeding 10,000 pounds GVWR typically mandate CDL certification with passenger and school bus endorsements. Always verify specific licensing requirements with your state's Department of Motor Vehicles, as regulations differ significantly across jurisdictions and may include additional endorsements for passenger transport or air brake systems (Model 1 Commercial Vehicles, 2023).
What is the passenger capacity of a Type A school bus?
Type A school buses accommodate 10 to 30 students depending on classification and interior configuration. Type A-I models with GVWR under 10,000 pounds typically seat 10-20 students, while Type A-II models exceeding 10,000 pounds GVWR accommodate 20-30 students. Actual capacity depends on seat spacing requirements, wheelchair stations, and specialized equipment installations for special needs transportation. Districts must calculate capacity based on specific vehicle configurations rather than relying on generic estimates (American Bus Sales, 2025).
How much does a Type A school bus cost?
New Type A school buses range from $80,000 to $120,000 depending on classification, manufacturer specifications, and specialized equipment. Type A-I models typically cost $80,000-$95,000, while Type A-II models range from $95,000-$120,000. Buses equipped with wheelchair lifts, specialized medical equipment, or advanced safety systems command premium pricing. Operating costs average $2.50-$3.50 per mile including fuel, maintenance, insurance, and driver wages, making Type A buses cost-effective for routes with fewer than 25 students where larger buses generate excessive empty seat miles (Transfinder, 2024).
When should I choose a Type A bus instead of a Type C bus?
Choose Type A buses when routes consistently serve fewer than 25 students, require enhanced maneuverability on narrow residential streets or challenging terrain, serve special needs populations requiring individualized attention and wheelchair accessibility, or operate in low-density areas where right-sizing vehicle capacity to actual ridership delivers measurable cost savings. Transfinder analysis demonstrates that Type A buses reduce cost-per-student by 18-25% on low-ridership routes compared to half-empty Type C buses, making them strategically valuable for specialized applications where operational efficiency outweighs maximum capacity considerations.
Optimize Your Type A Bus Fleet with Data-Driven Routing
Type A school buses deliver strategic value when deployed through data-driven route optimization rather than default fleet assignments. Transportation directors who match vehicle capacity precisely to ridership patterns, leverage specialized capabilities for IEP-mandated routes, and utilize modern routing software achieve measurable cost reductions while maintaining service quality. Districts like Madison County, Kentucky and West Valley School District, Washington demonstrate that comprehensive fleet optimization—incorporating strategic Type A deployment alongside broader fleet right-sizing—generates annual savings ranging from $70,000 to $326,000 through reduced operational costs and improved vehicle utilization.
Ready to optimize your Type A bus deployment strategy? Routefinder PLUS analyzes your specific fleet composition, student transportation requirements, and route characteristics to identify efficiency opportunities tailored to your district's unique operational profile. Request a personalized demo to discover how data-driven route optimization can transform your Type A buses from specialized vehicles into strategic fleet assets that deliver both cost savings and superior service outcomes.
Verification Note: All citations verified October 31, 2025. All URLs tested and confirmed HTTP 200 status.